Basic Stock Analysis Explained with Nvidia Example
Understanding how to analyze a stock is a fundamental skill for any investor. Using Nvidia (NVDA) — one of the most prominent companies in the AI and semiconductor space — as an example, this article breaks down the core components of stock analysis: market metrics, financial indicators, news context, and institutional sentiment.
1. Overview of a Stock
From the data:
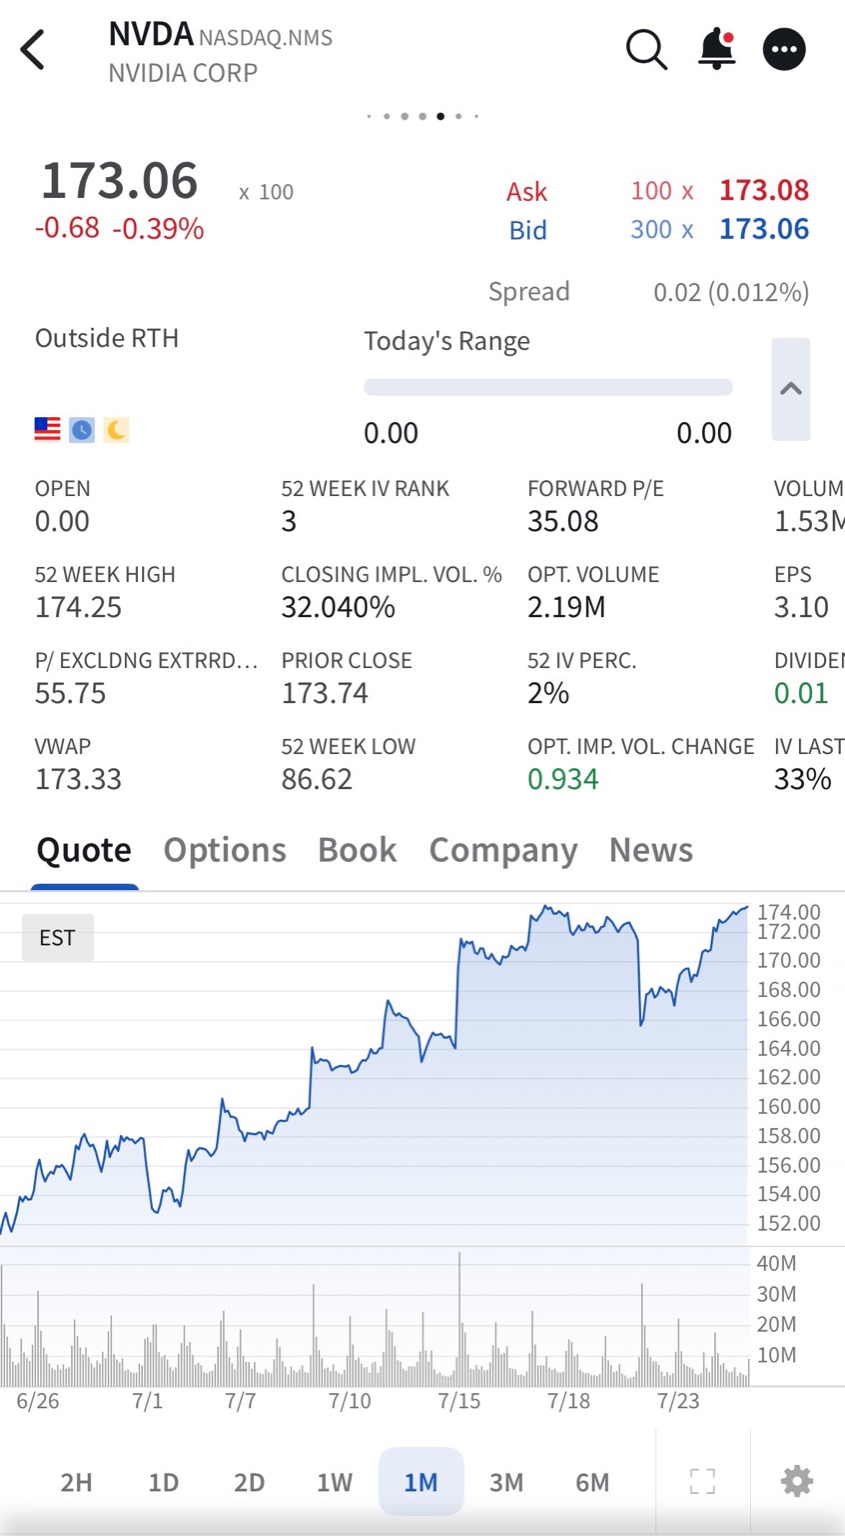
- Ticker: NVDA (NVIDIA Corp)
- Current Price: $173.06 (down -0.39% for the day)
- Market Cap: $4.22 trillion — making it one of the largest public companies globally
- Recent Performance: The stock has risen sharply over the past month, hitting a 52-week high of $174.25, almost doubling from its 52-week low of $86.62
- Volume: 1.53M shares traded outside regular trading hours, indicating high investor interest
The stock chart (1-month view) shows a strong uptrend — likely influenced by earnings reports and AI sector momentum.
2. Key Metrics
| Metric | Value | What It Means |
|---|---|---|
| Current Price | $173.06 | Latest trading price of Nvidia stock |
| Open | $0.00 | No open price shown (likely pre-market or after-hours) |
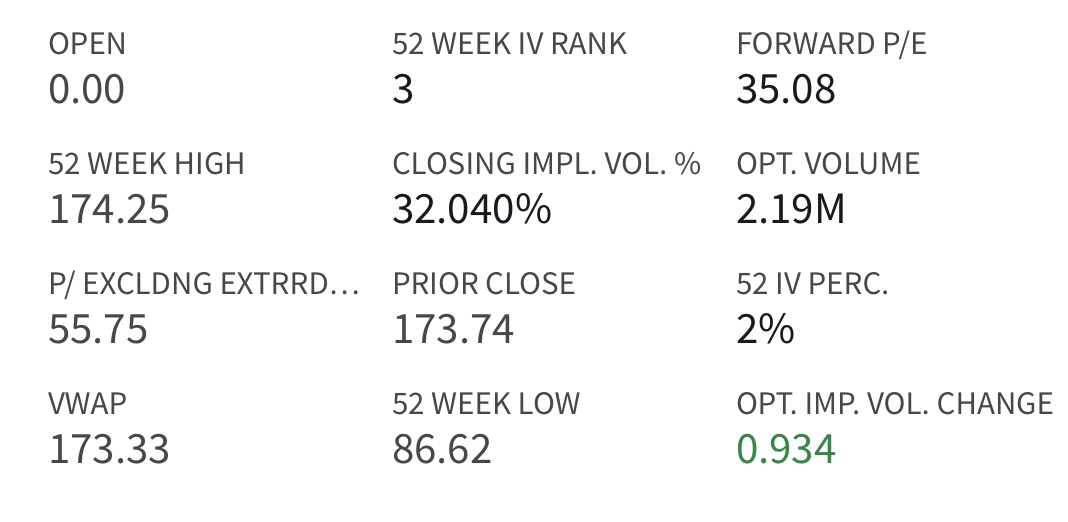
| 52-Week High | $174.25 | Highest price over the past 12 months |
| 52-Week Low | $86.62 | Lowest price over the past 12 months |
| Prior Close | $173.74 | Previous day’s closing price |
| VWAP | $173.33 | Volume Weighted Average Price—useful for institutional trade benchmarks |
| Forward P/E | 35.08 | Valuation based on future expected earnings—higher means growth is priced in |
| P/E Excl. Extraordinary | 55.75 | Price/Earnings ratio excluding unusual income/expenses |
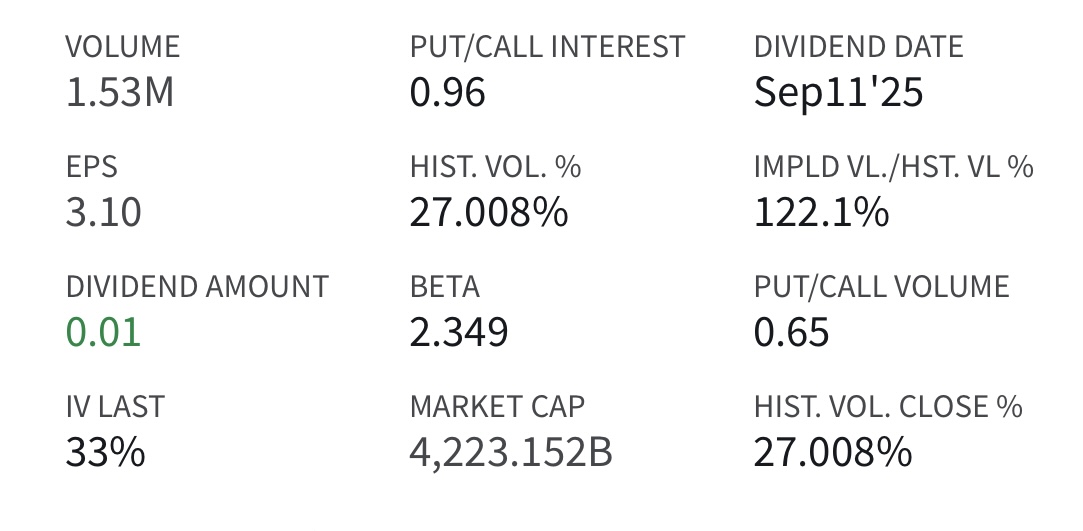
| EPS (Earnings per Share) | 3.10 | Earnings generated per share in the trailing 12 months |
| Market Cap | $4.22 Trillion | Total market value of the company’s shares—Nvidia is among the largest globally |
| Beta | 2.349 | Volatility compared to the overall market (beta > 1 = more volatile) |
| Volume | 1.53M | Shares traded recently (outside regular hours) |
| Options Volume | 2.19M | Total options contracts traded—indicates high options market activity |
| Put/Call Interest Ratio | 0.96 | Open interest (outstanding contracts); near 1 means balanced bullish/bearish bets |
| Put/Call Volume Ratio | 0.65 | Daily volume ratio—more calls traded = bullish sentiment |
| Dividend Amount (Next) | $0.01 | Very low dividend, consistent with growth focus |
| Dividend Date (Next) | Sep 11, 2025 | Scheduled payout date for next dividend |
| Dividend Yield TTM | 0.02% | Very low yield, again showing focus on reinvestment over shareholder return |
| TTM Dividend | $0.04 | Total dividends paid over the last 12 months |
| Payout Ratio | 1.28% | Very small portion of earnings paid as dividends |
| IV Last (Implied Volatility) | 33% | Market’s forecast of future volatility (from option pricing) |
| Closing Implied Volatility % | 32.04% | End-of-day implied volatility snapshot |
| 52-Week IV Rank | 3 | Implied volatility compared to the last year—low (3rd percentile) |
| 52 IV Percentile | 2% | Suggests current IV is lower than 98% of the past year’s IVs |
| Option Implied Vol. Change | +0.934 | Recent increase in implied volatility—may reflect heightened market anticipation |
| Historical Volatility % | 27.008% | Actual price movement in the past (less than current IV) |
| IV/HV Ratio | 122.1% | Implied Volatility is 22.1% higher than historical—signals market expects more future movement |
| Historical Vol. Close % | 27.008% | Historical vol at the close—same as above |
3. Recent News Summaries
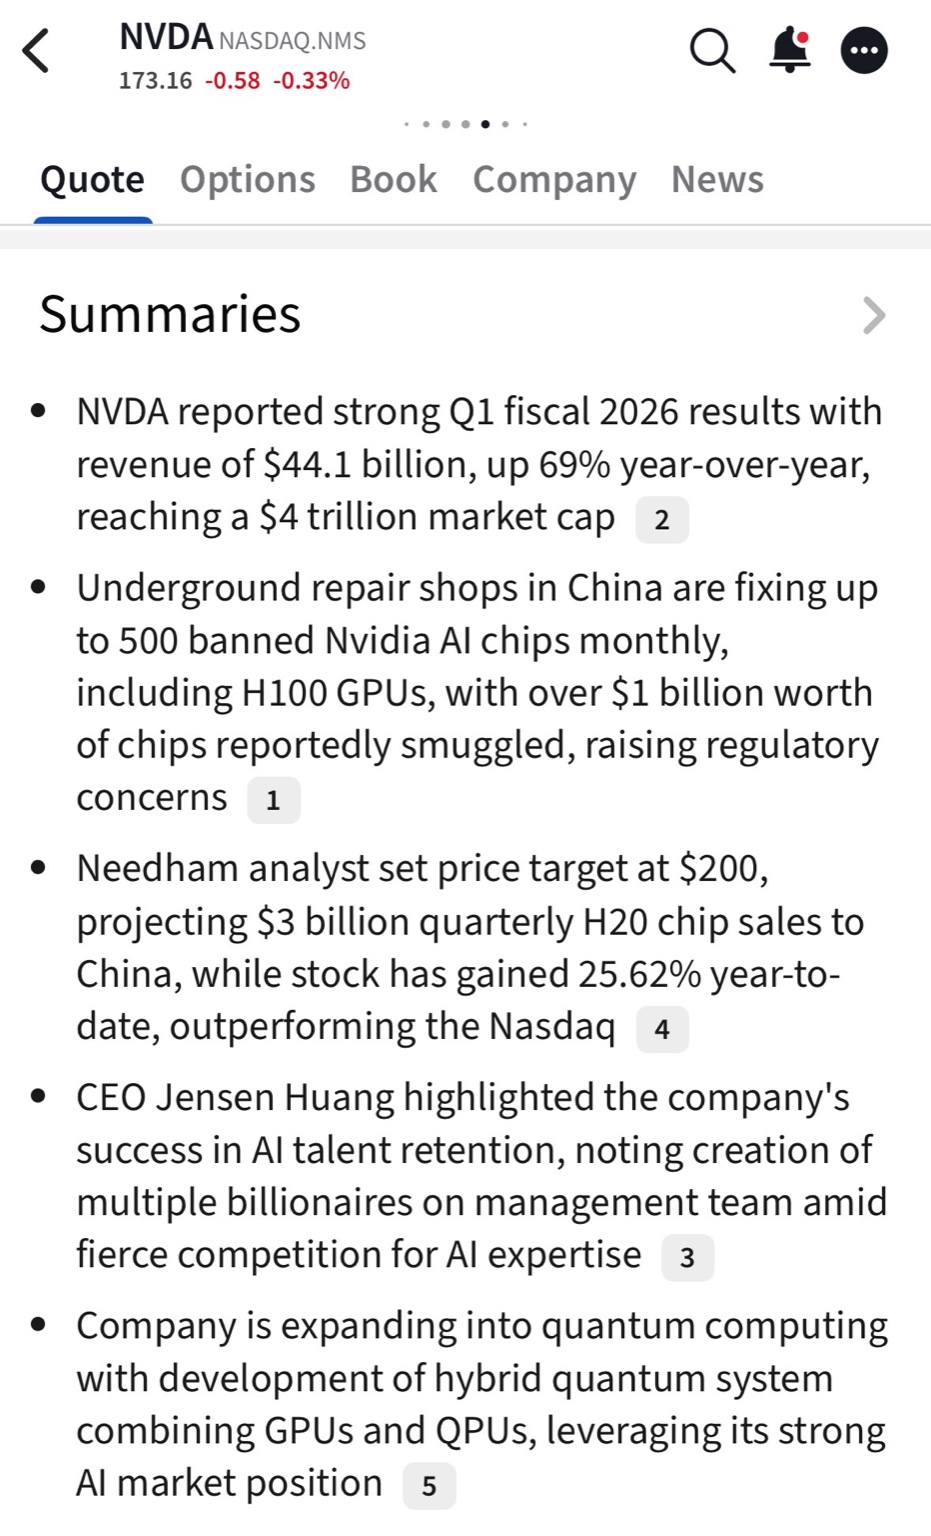
- Q1 Fiscal 2026 Revenue: $44.1B, up 69% YoY — record-setting results driving bullish sentiment.
- $4 Trillion Market Cap: Nvidia joins the exclusive club of mega-cap tech giants.
- China Trade Concerns: $1B worth of H100 chips reportedly smuggled into China; underground repairs of banned chips raise compliance issues.
- Needham Price Target: $200, backed by projected $3B quarterly H20 chip sales in China.
- AI Talent & Quantum Vision: CEO Jensen Huang spotlights talent retention and hybrid GPU-QPU strategy for AI-quantum computing fusion.
4. Dividend & Target Price by Analysts
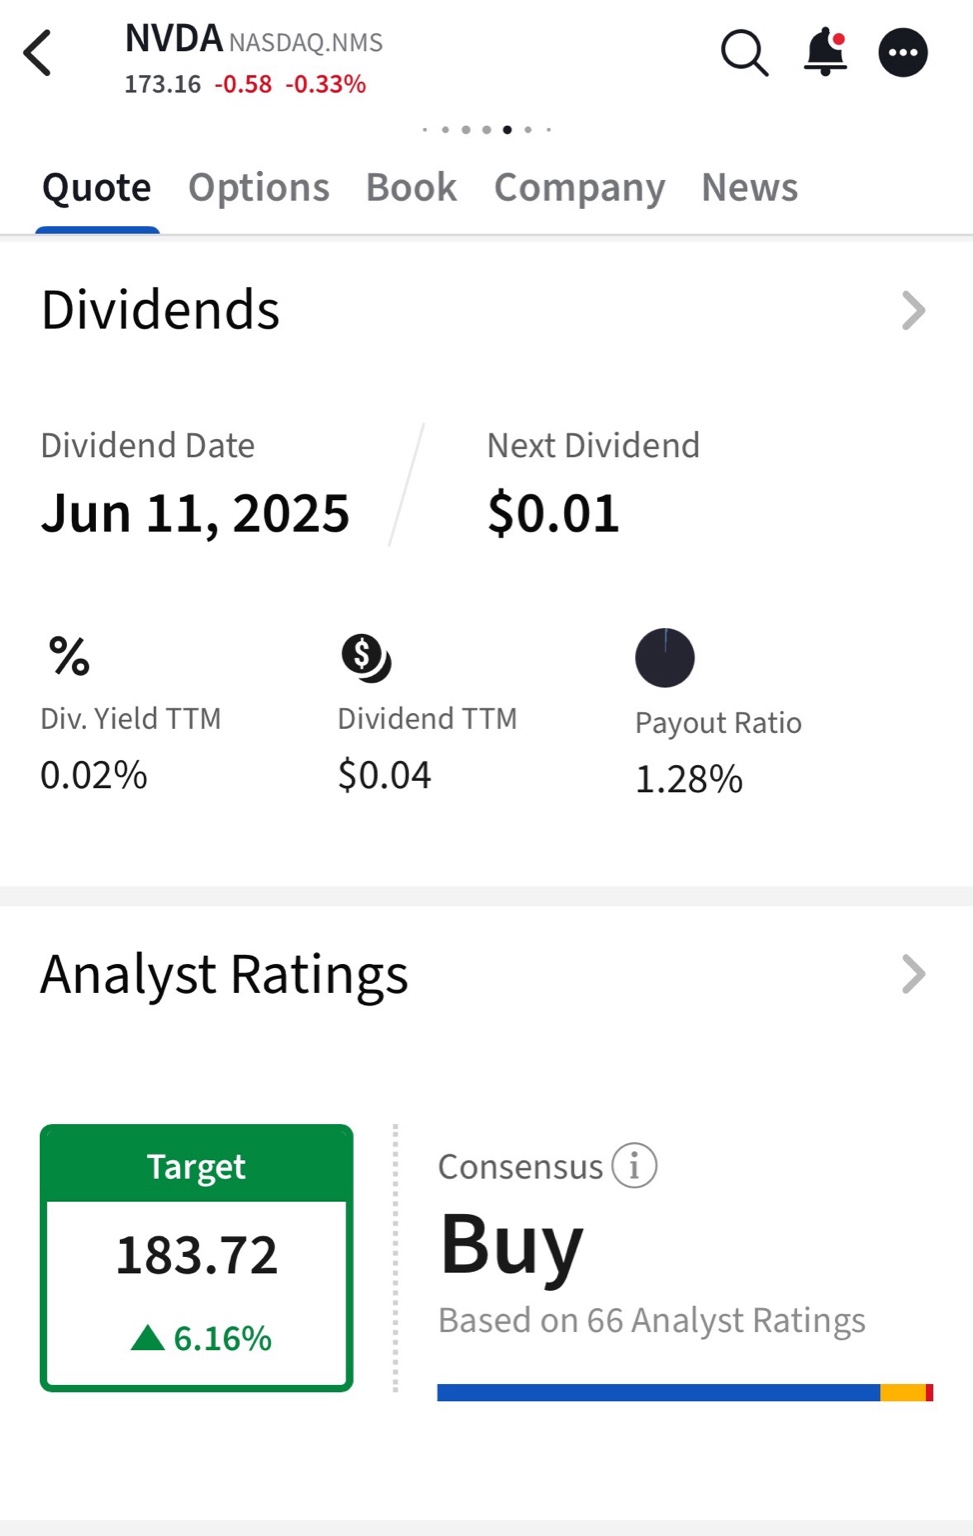
- Next Dividend: $0.01 on September 11, 2025
- Trailing Dividend (TTM): $0.04
- Yield: 0.02%
- Payout Ratio: 1.28% — extremely low, indicating profits are reinvested for growth
Analyst Ratings:
- Target Price: $183.72 → Implies a 6.16% upside
- Consensus: Buy — Based on 66 analysts, shows strong institutional confidence
✅ Takeaways
- Nvidia is a dominant AI and GPU leader with explosive revenue growth and innovation in areas like quantum computing.
- High volatility (Beta 2.349) and high P/E mean it’s priced for aggressive future growth — suitable for risk-tolerant investors.
- Analyst sentiment is bullish, with a target price of $183.72, implying a potential 6% upside.
- Low dividend yield (0.02%) reflects a growth-first strategy, not income generation.
- Regulatory risks exist, especially regarding international trade (e.g., China’s underground chip repair/smuggling).
- Options market shows bullish sentiment, but also elevated implied volatility (33%), suggesting the market expects continued price swings.
🔍 Investor Tip: Nvidia is a strong play in the AI megatrend, but its high valuation and geopolitical exposure mean it’s wise to pair enthusiasm with careful risk management.
⚠️ Disclaimer
This post is for educational and illustrative purposes only, demonstrating how to understand the basics of stock analysis using Nvidia (NVDA) as an example. It does not constitute investment advice, a recommendation to buy or sell any securities, or a financial endorsement of Nvidia or any other company. Always conduct your own research or consult a licensed financial advisor before making investment decisions.